

5 Ways You Can Fix Your Reporting System
Mar 17, 2023Most MSPs are getting reporting all wrong.
You send boring reports, with boring information, that honestly, just get filed away with the rest of the Newsletters and other random useless stuff that your customers receive.
But your reports are some of the most important things to your business and your clients - so here are 5 ways that you can level up your business by using something as historically boring as reports.
And for the purpose of this post, I’m going to be using Brightgauge as an example, and you can get a 3-month free trial of Brightgauge, with no pressure to buy it after 3 months, by hopping into my Discord server and asking me, which I’ll leave the link for below to.
NUMBER 1 - REGULAR REPORTING
You should be sending weekly, or monthly reports to your clients with information that THEY and YOU care about.
How many hours have you spent fixing things, highlight anything in red that’s above what it should be.
Which users are raising the most support cases, i.e - who is being a pain to your support team? By doing this, you can offer additional support such as training, or at least the client now knows they have a difficult member of staff who doesn’t know how to work a computer.
Show them your average response time to issues. How much downtime their business has suffered this month - hopefully 0…
Show them the upcoming renewals they have, maybe they have hardware whose warranty is expiring or SSL certificates that need renewing, but you can show them the next 12 months' worth of renewals pulled from your RMM platform.
And show them your outstanding quotes - what quotes are they still yet to accept, how much are they, and when do they expire, which gives you a great talking point to try and push some new business through.
NUMBER 2 - INTERNAL REPORTS
You can use Brightgauge to produce Internal reports for you. There are 2 specifics that I’d like to call out there.
Firstly, your client profitability. Pull the data out from your PSA system, or your accounts system, and determine how much of that is product vs service, and how much profit there is, then deduct the amount of time you’ve spent on that client each month. Assuming you’ve already calculated the exact or average cost of your engineer's time that is.
Honestly, this is such an important report to have, and once it’s done, it’s done - and will forever give you accurate information so that you can now make important decisions on whether you fire a client or not.
Highlight the clients in Red who are making a loss, highlight clients in amber who are making less than £500 profit, and the rest in Green.
Now simply send the report to yourself every month, and scan through to look for the reds and ambers.
Sometimes the Reds and Ambers are OK, but if you get a client that’s been red for 3 months or more, then you likely have a bigger problem that you need to deal with.
We found that one of our biggest customers was actually making us a huge loss each month, once we’d factored in the time spent on them.
So now you have the data, you can have a conversation with your clients to figure out the best way forward. Either price goes up, or perhaps they invest in better systems that don’t have as many problems….
The second report I would create here is your Product or Service Matrix report. One that lists your clients down one side, and the products or services you offer across the top. Then you have a green check in each box when a client takes your service up.
This can be done really easily with tools like Brightgauge, because you can just make a tick appear when there’s a matching contract type for each client, and that’s exactly how we built our reports when running my own MSP.
It is super easy to do, it takes maybe 10 minutes to put together, assuming you have your contracts set up properly, to begin with, and now you have a clear idea of which clients you may want to speak to about taking on additional services, that they’re probably already using through other vendors!
NUMBER 3 - SERVICE DESK DASHBOARD
Now you’ve taken care of your Internal reports, you can focus more specifically on Dashboards for your service team.
These dashboards can be SO useful.
Show them the number of tickets that you have left to respond to today (that means tickets that have a due or next action date of today or earlier), and the average response time for today or the week.
You can pull together dashboards for pods of staff if you have them working at pods of desks.
Use them to show what tickets are assigned to them, maybe highlight the ones they’re actively working on in green (assuming they’ve marked them as In Progress), and highlight any which have breached SLA in Red, there’s so much stuff you can do.
For engineers, I even created an Overtime report which was sent to me at the beginning of every month. This scooped up all the time logged in our ticketing system as the ‘Overtime’ work type, and listed how many hours and at either 1x or 2x rate. I can just grab that report, send it to my accounts team, and they know exactly who needs to be paid what.
And the great news is, that because this is all information pulled straight from your PSA, it means that you know the customers have also been billed for it properly too.
NUMBER 4 - BUSINESS DASHBOARDS
Next up, Business Dashboards.
These are dashboards that you as a business owner, manager, or team leader can use to display valuable information.
For the owner, perhaps that’s money in the bank, the amount of money sat currently in the pipeline, the number of negative customer feedback responses, average response time for the business as a whole.
If you’re a manager, perhaps it’s a number of stale sales orders which haven’t been touched for a few days, or orders which you’re waiting on. Maybe it’s the financial value of orders which are yet to be invoiced or delivered.
These are what I call the Desert Island Dashboards.
Grab a few key pieces of information that you need to be able to tell whether your MSP is in good health or not, just by those numbers.
Again, highlight any bad numbers in red, so you can quickly glance at the screen and see if any need your attention.
NUMBER 5 - GOALS
Like I’ve said before, if you don’t have any goals, then you’ll never hit them.
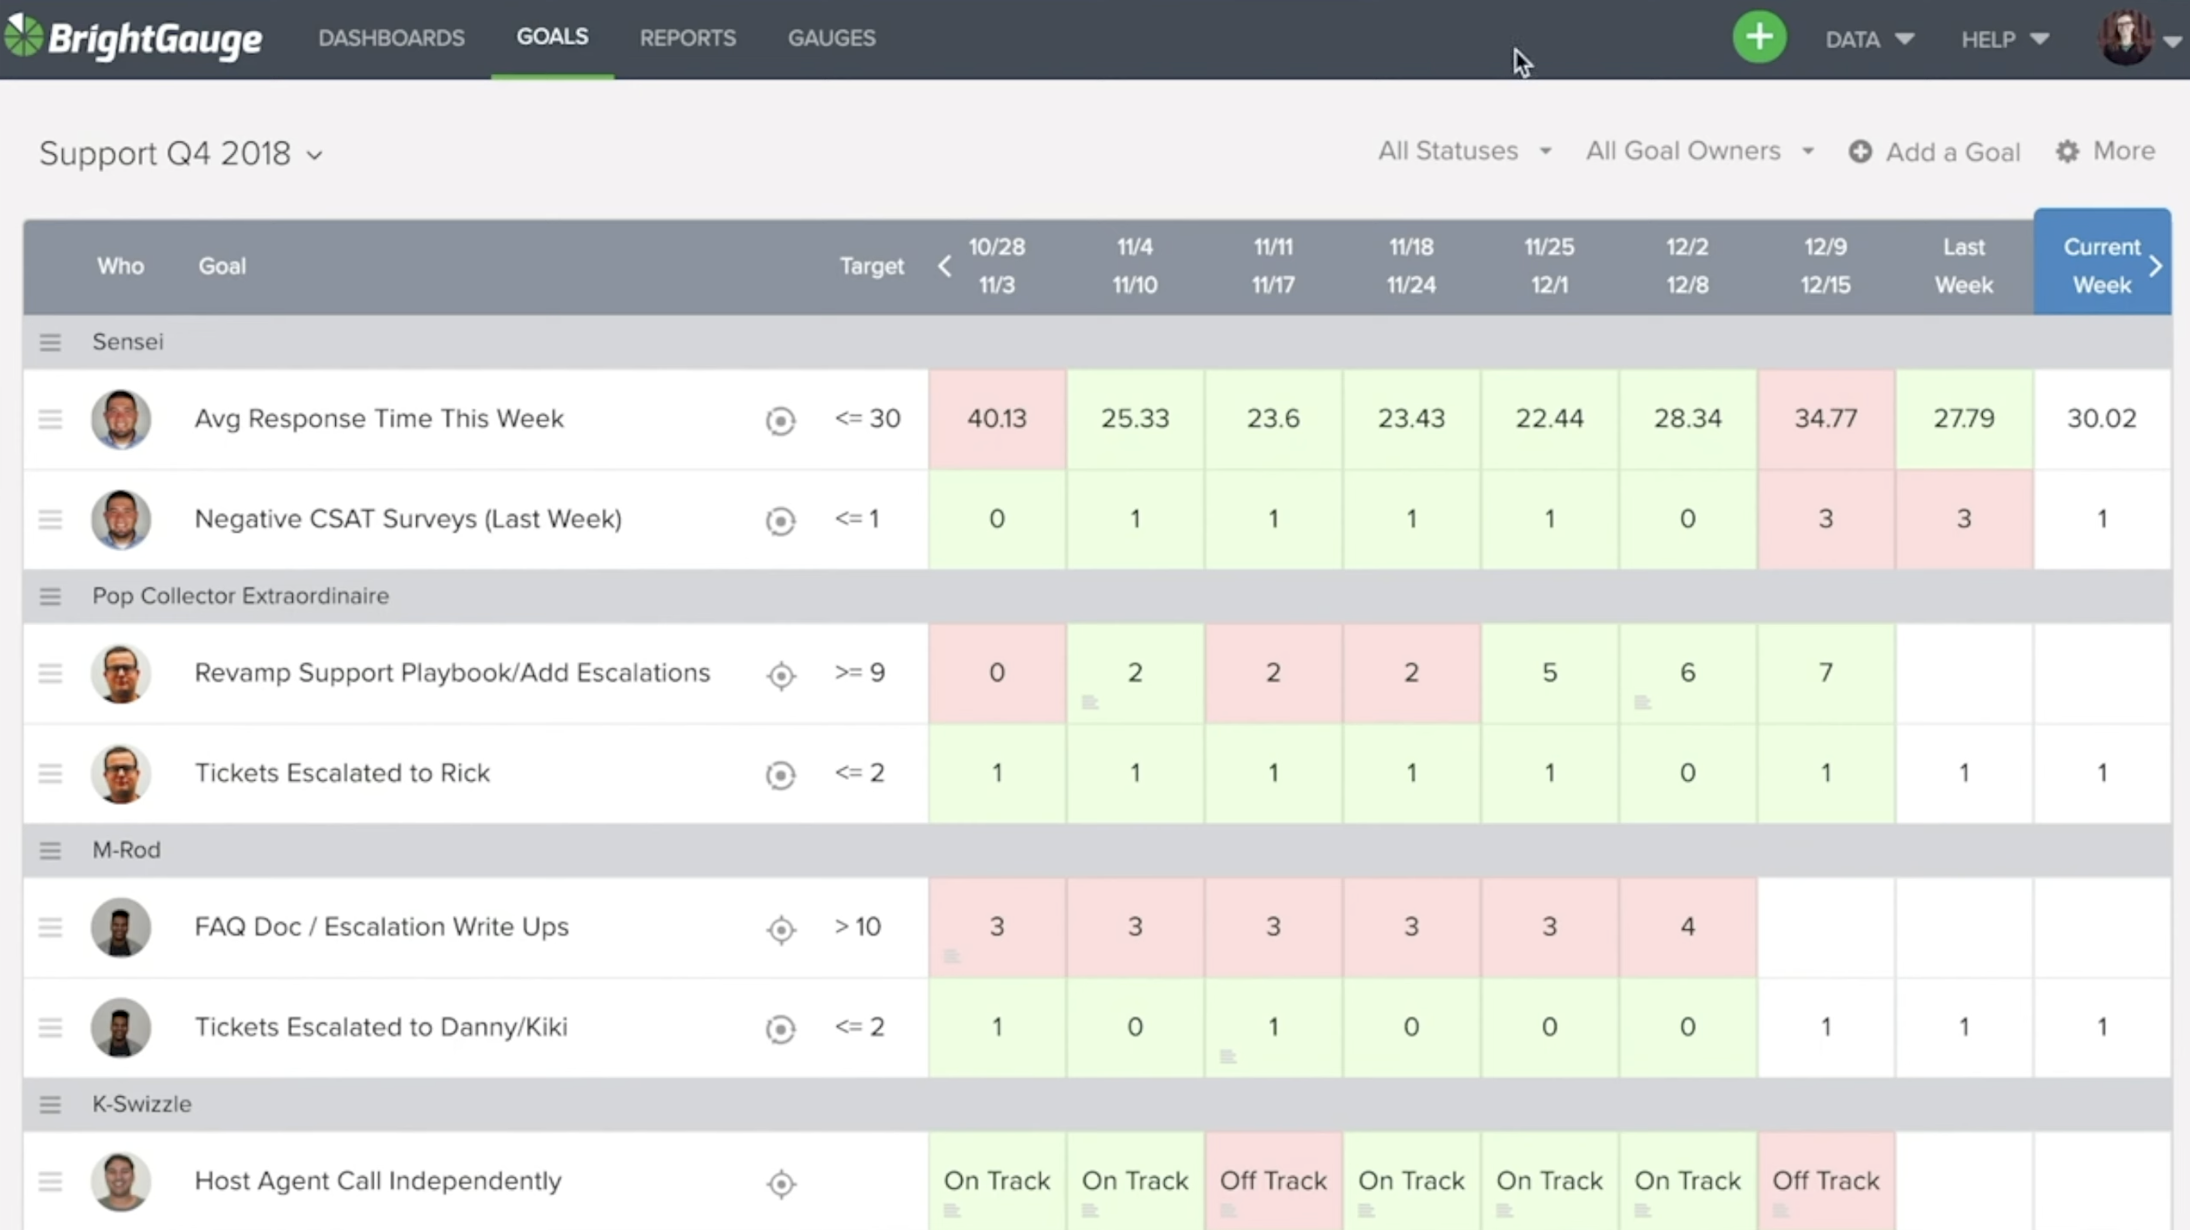
A feature I’ve loved about Brightgauge is their Goals section where you can track the historical progress of your goals.
Take your average response time for example. I wanted to hit 30 minutes or less, so my goal was 30 minutes, and now every week my helpdesk team can check in their goals with whatever the response time was that week, along with any comments as to why.
It was great for seeing when we did miss that goal but knew that it was because people were off sick or busy with projects, so we could adjust.
Maybe that’s a revenue goal because you want to hit that Magic £1m revenue, or a profit goal, or a number of negative staff feedback requests - perhaps just take your desert island KPIs that you’ve got above, and use those as your goals.
Now you can see over time, over weeks and months to see if you’re getting better, or getting worse, and adjust your business to suit.
Again if you want to give Brightgauge a trial for 3 months - this isn’t sponsored, Brightgauge isn’t paying me and I’m not making any commission here - I honestly just haven’t found anything as good as Brightgauge when it comes to reports, so it’s pretty difficult to make a post about reports without mentioning them.
So join the discord group and ping me a message and I can get a message over to Brightgauge to get that free trial setup for you.
My DISCORD Server Invite: https://discord.gg/mAXgA2uH
This. But in your Inbox!
Get the latest Blogs, Resources, Templates and Courses straight to your Inbox.
We hate SPAM. We will never sell your information, for any reason.